Seasonal Patterns Affecting User Activity on Regulated Digital Gaming Platforms in Multiple Jurisdictions
Jonas Lorenz · Jul 14, 2026
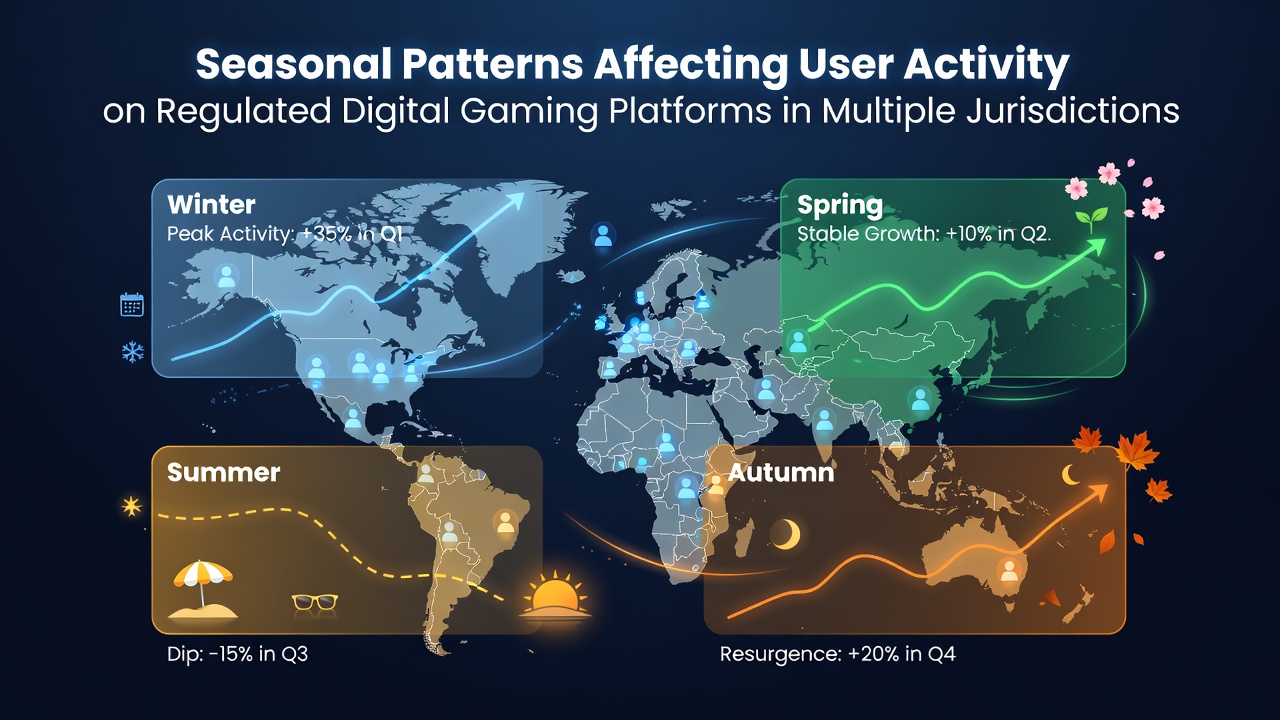
Seasonal Patterns Affecting User Activity on Regulated Digital Gaming Platforms in Multiple Jurisdictions
Regulated digital gaming platforms exhibit clear seasonal fluctuations in user activity that researchers track through login rates, deposit volumes, and session durations, and these patterns differ across jurisdictions such as New Jersey, Ontario, and several Australian states because local holidays, weather conditions, and sports calendars intersect with platform operations in distinct ways.
Holiday Periods Drive Consistent Upticks
December through early January produces measurable increases in engagement on platforms licensed in multiple regions, since end-of-year celebrations coincide with extended time at home and disposable income from bonuses or gifts, while data from North American operators shows deposit activity rising sharply in the week before Christmas and remaining elevated until mid-January, whereas Australian operators report similar spikes around the same calendar window despite reversed seasons because global promotional calendars align across borders.
Weather and Daylight Influence Session Lengths
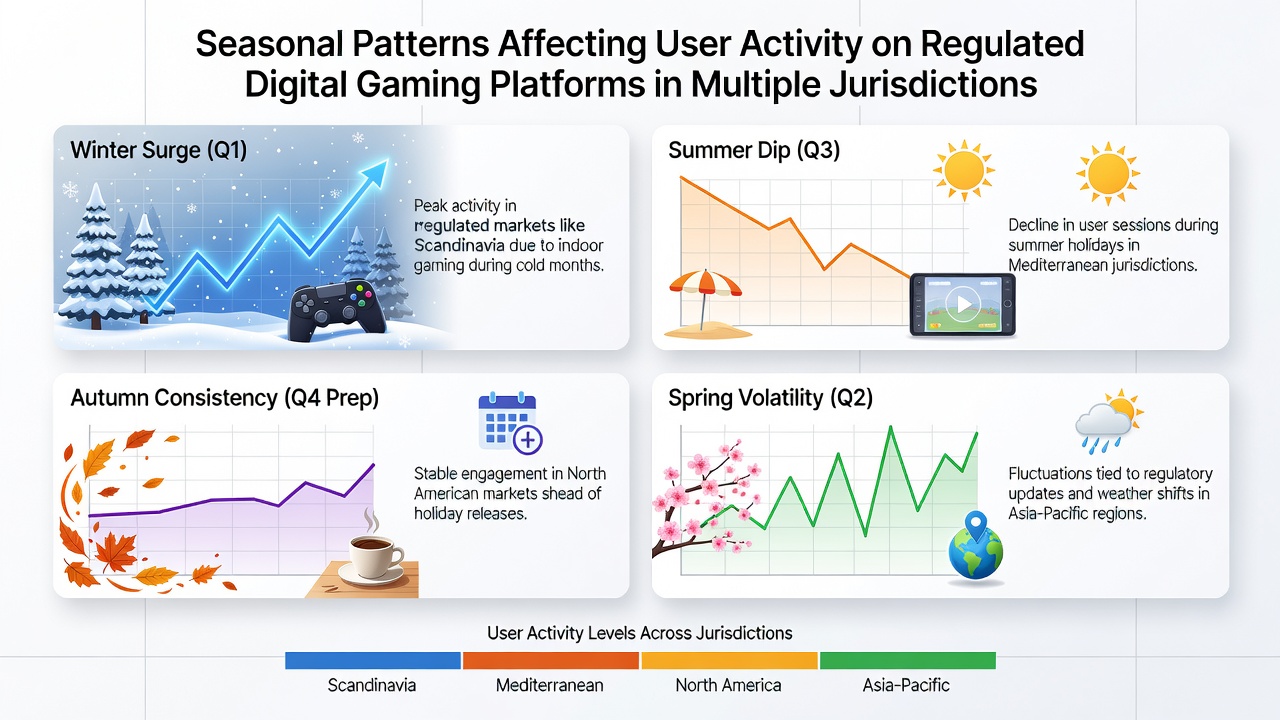
Colder months correlate with longer average play sessions in northern jurisdictions, because reduced outdoor activity leaves more indoor hours available, and analysts at the Alcohol and Gaming Commission of Ontario have documented that login frequency climbs steadily from November through February in that province while summer months show shorter but more frequent mobile sessions during warmer evenings, yet platforms in warmer Australian states display flatter winter curves and sharper summer dips when outdoor recreation competes directly with screen time.
Sports Calendars Shape Peak Windows
Major sporting events create predictable surges that cross jurisdictional lines, and the Super Bowl period in early February reliably lifts traffic on New Jersey and Pennsylvania platforms because live betting options draw casual users into regulated apps, while March Madness brackets produce secondary peaks in college basketball markets, and Canadian operators note parallel lifts during NHL playoffs although the timing shifts slightly each year depending on team performance, whereas Australian platforms experience their own spikes around the Australian Football League season that runs from March to September and overlaps with local regulatory reporting cycles.
Economic and Academic Cycles Add Layers
Tax refund seasons in the United States generate secondary activity waves in late winter and early spring, since lump-sum payments reach player accounts and operators observe deposit increases that last several weeks before tapering, and back-to-school periods in August and September produce noticeable declines across North American jurisdictions as families redirect spending, yet these patterns appear less pronounced in European markets where school calendars vary and regulatory bodies such as the Malta Gaming Authority compile aggregated figures that show steadier year-round baselines interrupted mainly by national holidays.
July 2026 Observations Highlight Summer Variations
Activity reports compiled through July 2026 indicate that platforms in multiple jurisdictions experienced typical summer moderation, with New Jersey operators recording lower evening session counts compared wth spring peaks and Ontario data showing increased mobile micro-sessions during vacation periods while desktop usage declined, and Australian regulators noted continued emphasis on evening play despite longer daylight hours because promotional calendars maintained steady engagement even as overall volumes eased from winter highs.
Cross-Border Comparisons Reveal Shared Drivers
Although regulatory frameworks differ, core seasonal drivers remain consistent enough that analysts compare datasets from the New Jersey Division of Gaming Enforcement alongside Ontario reports and Australian state summaries to identify overlapping trends, and these comparisons reveal that holiday and sports influences operate universally while weather effects invert between hemispheres, allowing operators to adjust server capacity and promotional timing without violating local rules on responsible gaming messaging.
Conclusion
Seasonal patterns on regulated digital gaming platforms arise from the intersection of calendar events, climate, and economic cycles, and operators across New Jersey, Ontario, Australia, and other jurisdictions monitor these shifts through standardized reporting that informs both capacity planning and compliance with regional oversight requirements.